Body Section Links
BODY EMBLEMS
Emblems Drawings and Placement
EXTERIOR DIMENSIONS
Glass
GRILLE
HOOD
Moldings
PAINT COLORS
POTPOURRI
Production Calendar
PRODUCTION NUMBERS
Rear Panel
SERIES/MODEL
Sheet metal
Trunk/Cove
Trim - Chevelle 300
Trim - Chevelle 300 Deluxe
Trim - Malibu
Trim - SS 396
Trim - El Camino
Production Numbers
The Series/Body Style columns correspond to VIN series & body style and not Fisher Body plate Style numbers.
| 1966 Chevelle Series/Model |
Six Cylinder |
Eight Cylinder |
|||
|
Series/ |
Produced | Series/ Body Style |
Produced | Total | |
| Chevelle 300, 2-door convertible (Canada only)(2) |
13167 | unk | 13267 | unk | unk |
| Chevelle 300, 2-door sedan Export Total |
13111 | 11,401 67 11,468 |
13211 | 2,120 15 2,135 |
13,521 82 13,603 |
| Chevelle 300, 4-door sedan Export Total |
13169 | 11,178 691 11,869 |
13269 | 3,129 64 3,193 |
14,307 755 15,062 |
| Chevelle 300 Deluxe, 2-door
sedan Export Total |
13311 | 8,792 384 9,176 |
13411 | 2,967 38 3,005 |
11,759 422 12,181 |
| Chevelle 300 Deluxe, 4-door
wagon Export Total |
13335 | 5,064 119 5,183 |
13435 | 4,936 92 5,028 |
10,000 211 10,211 |
| Chevelle 300 Deluxe, 4-door
sedan Export Total |
13369 | 17,348 587 17,935 |
13469 | 7,368 167 7,535 |
24,716 754 25,470 |
| Chevelle 300 Deluxe, 2-door
sedan pickup Export Total |
13380 | 3,278 146 3,424 |
13480 | 5,772 125 5,897 |
9,050 271 9,321 |
| Malibu, 4-door wagon Export Total |
13535 | 3,686 71 3,757 |
13635 | 17,758 220 17,978 |
21,444 291 21,735 |
| Malibu, 4-door Sport Sedan Export Total |
13539 | 4,892 230 5,122 |
13639 | 19,303 602 19,905 |
24,195 832 25,027 |
| Malibu, 2-door coupe Export Total |
13517 | 27,145 1,035 28,180 |
13617 | 129,022 1,518 130,540 |
156,167 2,553 158,720 |
| Malibu, convertible Export Total |
13567 | 2,527 22 2,549 |
13667 | 11,588 48 11,636 |
14,115 70 14,185 |
| Malibu, 4-door sedan Export Total |
13569 | 15,134 1,294 16,428 |
13669 | 26,815 536 27,351 |
41,949 1,830 43,779 |
| Malibu, 2-door
sedan pickup Export Total |
13580 | 1,382 79 1,461 |
13680 | 24,229 108 24,337 |
25,611 187 25,798 |
| SS 396, 2-door sport coupe Export Total |
13817 | n/a* | 13817 | 66,380 463 66,843 |
66,380 463 66,843 |
| SS 396, convertible Export Total |
13867 | n/a* | 13867 | 5,393 36 5,429 |
5,393 36 5,429 |
| Total Production Export Total |
111,827 4,725 116,552 |
326,780 4,032 330,812 |
438,364 8,757 447,364 |
||
Caveats:
(1) The total production according to the reported last VIN of each
assembly plant totals 446,633 leaving 731 units built in the U.S. unaccounted
for in the above figures. However if you look at the table below of
'reported last VIN' versus VINs that have shown up from plants, the
last reported VIN for a given month does not always correspond with
Fisher Body dates and, in the case of Fremont at least so far, there
were at least 236 (159310-159074=236) more Chevelles produced there
than the last reported VIN indicates.
(2) Production for Canada is listed at 23,688 units (some report only
20,112) but specific series/model are not included in the series/model
figures for 1966. The 23,688 number is pretty evenly split between 6-cylinder
and 8-cylinder engines with 11,731 6-cylinder models and 11,957 8-cylinder
models built. However, it is known from GM of Canada documentation
that there were 230 series/model 13267 V8 300 convertibles built, 1,477
13517 L6 Malibu sport coupes, and 5,081 13617 V8 Malibu sport coupes
built.
(3) GM of Canada did not include all model lines of its U.S. counterpart,
only the 300 series and Malibu series were produced. As a sort of compensation,
a 300 series convertible was offered in Canada and the base sedan pickup
was based on the 300 series and not the 300 Deluxe series.
* n/a for the SS 396 Sport Coupe and SS 396 Convertible indicates the
series/model was not available with a 6-cylinder engine.
Production Numbers by Plant and Month
| Listed are the last known reported VIN for each plant for the specific month. | ||||||
| Month | Atlanta | Baltimore | Flint | Framingham | Fremont | Kansas City |
| August - 1965* | n/a | n/a | n/a | n/a | n/a | n/a |
| September | 101412 |
09E-104206 103848 |
100853 | 101687 | 101475 | 104144 |
| October | 105800 | 112708 | 103943 | 106735 | 105951 | 115344 |
| November | 110626 | 123145 | 107441 | 111910 |
12A-111467 111304 |
127866 |
| December | 115184 | 133029 | 112016 | 116955 | 117131 | 139728 |
| January - 1966 | 119309 | 141040 | 116138 | 120730 | 123704 | 150978 |
| February | 126651 | 148979 | 120851 | 123115 | 129884 | 162260 |
| March | 141390 | 157051 | 127215 | 125958 | 136574 | 175796 |
| April | 155291 | 164643 | 132456(1) | 128913 | 142300 |
04D-187543 186929 |
| May |
05D-168913 168663 |
172643 | 138373 | 131979 |
05E-148858 05D-149161 148104 |
05D-197447 197387 |
| June |
06E-184288 182751 |
180692 | 144554 | 135211 | 154174 | 208293 |
| July | 195611 | 188331 | 147455 | 138111 |
07D-159112 07D-159310 159074 |
218051 |
| Total 446,633 |
95,611 | 88,331 | 47,455 | 38,111 | 59,074 | 118,051 |
Bear in mind the are the last known VINs for these plants and the total of 446,633 falls short of the reported U.S. production total of 447,364 U.S.-built Chevelles by 731 units. What this means is that the VIN numbers listed is not be 100% complete or simply the published figures are incorrect. The numbers for Fremont are a good example of this. The last reported VIN sequence was 159704 yet there is one example on this CD of 159310 or at least 236 units more than reported. It is quite possible, although there's no documented proof yet, that other plants may incur the same discrepancy.
* Although there were Chevelles with body dates in August 1965, August and September totals are listed in September only. For those of you who enjoy numbers, the table at the bottom of the page expands on the table above to break down the number of Chevelles assembled at each plant each month and on average the number assembled per day and per hour of each day.
(1) Number reported is not consistent with a known VIN of 135xxx and known body date of April, 3rd week.
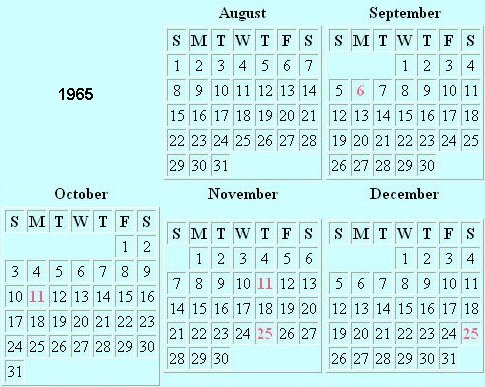
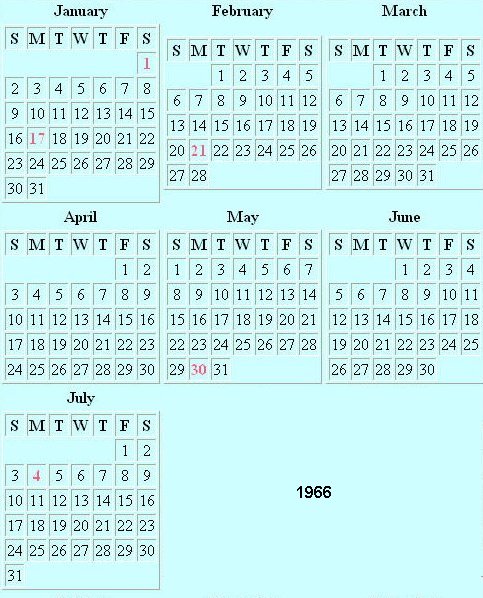
1966 Model Year Production Calendar
Production Numbers per month/per day/per hour
Remember, these are only AVERAGES assuming a 16-hour workday, 5 days a week, no down time and no model changeover time. These figures are not to be interpreted as actual production numbers. All calculated numbers are rounded down except when less than 1 (one). September figures include all of August as well. Cars per month are calculated on difference between current month and past month, Monday through Friday non-holiday work days per month and 16 hours per work day. Some plants surely had differing schedules due to holidays and are not incorporated in this fun calculation.
| Listed are the last known VIN for each plant for the specific month | ||||||
| Month | Atlanta | Baltimore | Flint | Framingham | Fremont | Kansas City |
| Aug-1965* | n/a | n/a | n/a | n/a | n/a | n/a |
| Sep (21/336) | 101412 | 103848 | 100853 | 101687 | 101475 | 104144 |
| Month/Day/Hour | 1412/67/4 | 3848/183/11 | 853/40/2 | 1687/80/5 | 1475/70/4 | 4144/133/8 |
| Oct (20/320) | 105800 | 112708 | 103943 | 106735 | 105951 | 115344 |
| Month/Day/Hour | 4388/219/13 | 8860/443/27 | 3090/154/9 | 5048/252/15 | 4476/223/13 | 11200/560/35 |
| Nov (20/320) | 110626 | 123145 | 107441 | 111910 | 111304 | 127866 |
| Month/Day/Hour | 4826/241/15 | 10437/521/32 | 3498/174/10 | 5186/259/16 | 5353/267/16 | 12522/626/39 |
| Dec (23/368) | 115184 | 133029 | 112016 | 116955 | 117131 | 139728 |
| Month/Day/Hour | 4558/198/12 | 9884/429/26 | 4575/198/12 | 5045/219/12 | 5827/253/16 | 11862/515/32 |
| Jan-1966 (20/320) | 119309 | 141040 | 116138 | 120730 | 123704 | 150978 |
| Month/Day/Hour | 4125/206/12 | 8011/400/25 | 4122/206/12 | 3775/188/11 | 6573/328/20 | 11250/562/35 |
| Feb (19/304) | 126651 | 148979 | 120851 | 123115 | 129884 | 162260 |
| Month/Day/Hour | 7342/386/24 | 7939/417/26 | 4713/248/15 | 2385/125/7 | 6180/325/20 | 11282/593/37 |
| Mar (23/368) | 141390 | 157051 | 127215 | 125958 | 136574 | 175796 |
| Month/Day/Hour | 14739/640/27 | 8072/350/21 | 6364/276/17 | 2843/123/7 | 6690/290/18 | 13536/588/36 |
| Apr (21/336) | 155291 | 164643 | 132456 | 128913 | 142300 | 186929 |
| Month/Day/Hour | 13901/661/41 | 7592/253/10 | 5241/361/22 | 2954/123/7 | 5726/272/17 | 11133/539/33 |
| May (21/336) | 168663 | 172643 | 138373 | 131979 | 148104 | 197387 |
| Month/Day/Hour | 13372/636/39 | 8000/380/23 | 5917/281/17 | 3066/146/9 | 5808/276/17 | 10458/498/31 |
| June (22/352) | 182751 | 180692 | 144554 | 135211 | 154174 | 208293 |
| Month/Day/Hour | 14088/640/40 | 8049/385/22 | 6181/280/17 | 3232/146/9 | 6070/275/17 | 10906/495/30 |
| July (20/320) | 195611 | 188331 | 147455 | 138111 | 159074 | 218051 |
| Month/Day/Hour | 12860/643/40 | 7639/396/24 | 2901/145/9 | 2900/145/7 | 4900/245/15 | 9758/487/30 |
| Total 446,633 |
95,611 | 88,331 | 47,455 | 38,111 | 59,074 | 118,051 |